Boodschap en claims testen
Meet hoe effectief uw marketingberichten zijn met een geautomatiseerde analyse van slogans, motto's, waardevoorstellen en meer.
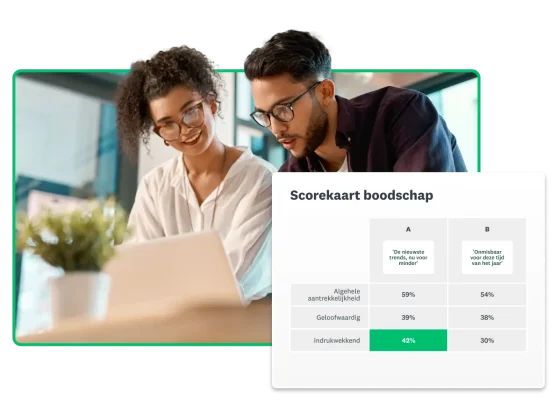
Toonaangevende merken gebruiken SurveyMonkey voor marktonderzoek


* Boodschappen en claims testen en enkele andere functies zijn alleen beschikbaar voor enquêtes in het Engels.

Vol vertrouwen nieuwe campagnes en content starten
Door uw boodschappen te testen, krijgt u een onschatbaar kijkje achter de schermen van wat doelgroepen vinden. Zo hoeft u geen tijd te verspillen aan een concept dat niet in de smaak valt of tijd te investeren in een idee dat geen positieve impact op de KPI's zal hebben. Overtuig management en investeerders sneller met data die aantonen dat uw boodschappen de perceptie van uw merk versterken, doelgroepen betrekken en het koopgedrag stimuleren.
Lees meer over de aanbevolen werkwijzen voor het testen van concepten en boodschappen.
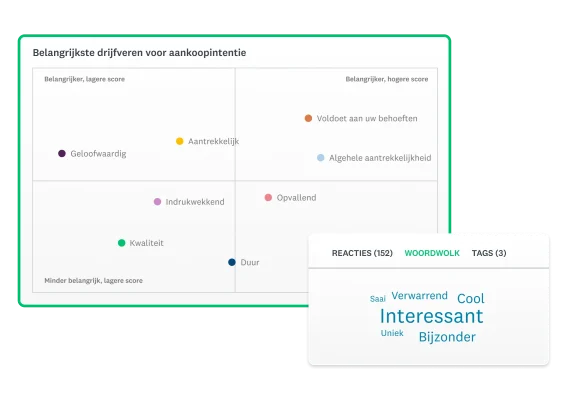
De belangrijkste drijfveren vinden die invloed hebben op de voorkeuren van klanten
Verzamel door AI gegenereerde inzichten zonder door ingewikkelde data te zoeken. Markeer in een woordwolk de meestgebruikte woorden en zinnen in reacties op open vragen. En herken automatisch trends in belangrijke segmenten, zoals hoe een groep anders reageert dan uw doelmarkt.
Sneller analyseren en meteen inzichten in uw data vinden
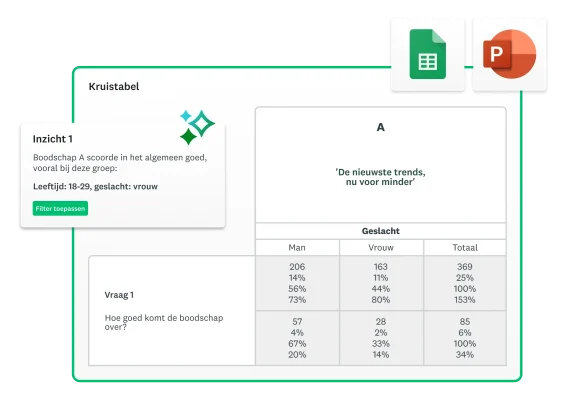
Onze AI-technologie maakt gebruik van zelflerende systemen om de kenmerken te vinden waarmee u opvalt. U ziet meteen welke groepen goed hebben gereageerd op uw boodschappen. Zie welke boodschappen populair zijn in elke leeftijdsgroep, inkomensgroep, geografische locatie en andere criteria die u kiest.
U hoeft niet langer handmatig te sorteren of filteren in spreadsheets. Krijg snel inzichten in een bestandsindeling die u gemakkelijk kunt delen: een PowerPoint-presentatie, CSV, XLS, SPSS en meer.
Kwalitatieve, wereldwijde gegevens
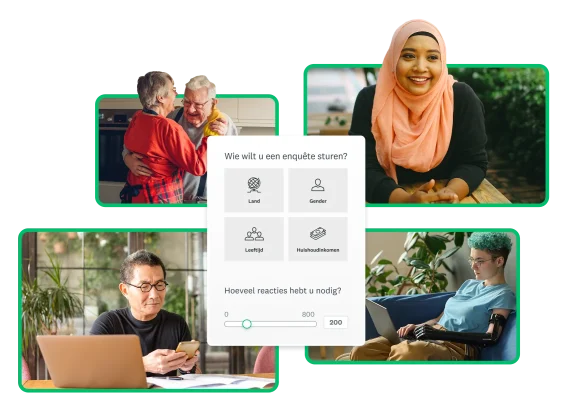
We koppelen bewezen enquêtemethodologie aan ons wereldwijde panel van SurveyMonkey Audience, zodat u uw onderzoek kunt aanpassen en precies de doelgroep vindt die u nodig hebt. Kom in contact met meer dan 335 miljoen mensen in meer dan 130 landen, van consumenten tot professionals, en doe betrouwbare inzichten op.
Na de start van uw enquête schonen we uw gegevens automatisch op en verwijderen we ongewone reacties. Zo weet u zeker dat u alleen betrouwbare inzichten krijgt.
Wilt u uw klanten een enquête sturen? Dat kan met hyperlinks via e-mail, sociale media en andere kanalen.
Hoe werkt onze oplossing voor het testen van boodschappen en claims?
U kunt uw enquête gemakkelijk opstellen
Kies wat u wilt testen en naar welke doelgroep u uw enquête wilt sturen. Onze marktonderzoeksoplossing voor het testen van boodschappen en claims is gemaakt door experts en bevat vooraf geschreven vragen, die u gemakkelijk kunt aanpassen.
Betrouwbare methodologie, gemakkelijk te gebruiken
Het maakt niet uit of u een doorgewinterde marktonderzoeker bent of nog maar net begint in het vak. Op ons intuïtieve platform maakt u eenvoudig gebruik van onze bekroonde methodologie.
Snel inzichten ontdekken
Bespaar tijd op handmatige analyses en ontvang al in minder dan een uur door AI aangedreven inzichten. Deel uw conclusies snel in een rapport op maat, maak indruk op uw stakeholders en kies de juiste volgende actie.

‘Door inzichten uit marktonderzoek in te zetten, kon ons team sneller knopen doorhakken. Ook op de lange termijn hebben we er profijt van, aangezien teams de resultaten later opnieuw onder de loep nemen om nieuwe inzichten te ontdekken.’
Caitlin Roberts, Senior Product Marketing Manager, Kajabi
Onze oplossingen voor marktonderzoek
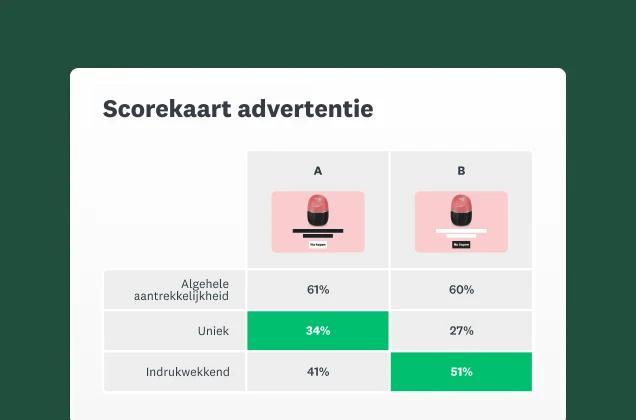
Advertenties testen
Test uw advertentiecampagnes voordat u ze lanceert.
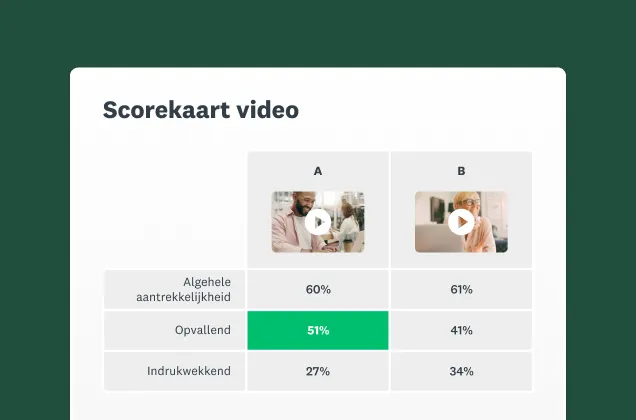
Test uw video's
Ontdek wat uw doelgroep van uw video's vindt.
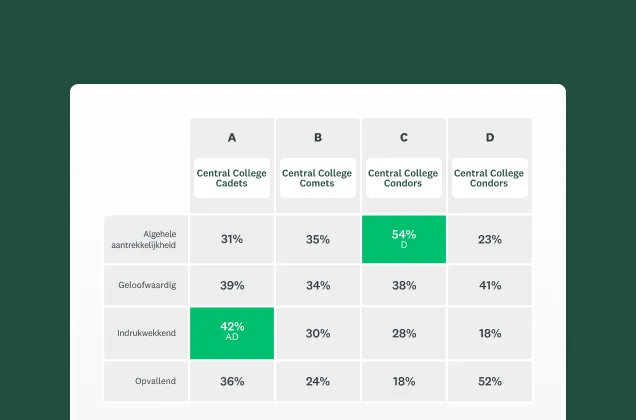
Naam testen
Test verschillende namen voor uw merk, product of service.
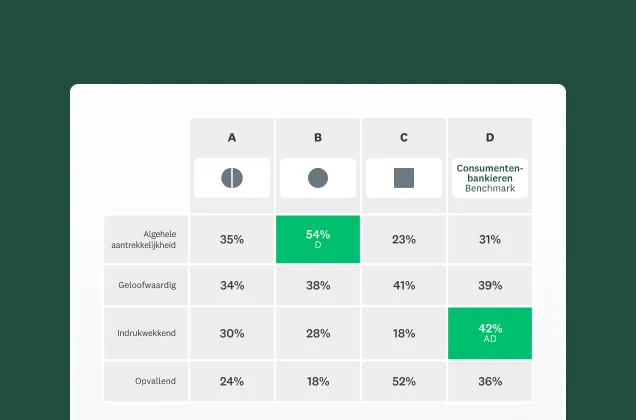
Logo-ontwerp testen
Ontdek wat het beste logo-ontwerp is voor uw merk of producten.